Headline findings
- On 1,286 airport pairs flown in both 1995 and 2025 (at least 30 flights each year), the median change in median air time was +2 minutes. 71.7% of those city-pairs (922 of 1,286) stayed within 3 minutes; 88.1% (1,133) stayed within 5 minutes.
- Treating those same 1,286 city-pairs as a constant basket, the median of their route-level median air times was 96 minutes in 1995 and 97 minutes in 2025. The basket never left a 96–100 minute range in any year of the panel.
- Air minutes per 1,000 miles — the ratio of the systemwide median AirTime to the systemwide median distance, times 1,000 — moved from 144.7 in 1995 to 144.3 in 2025.
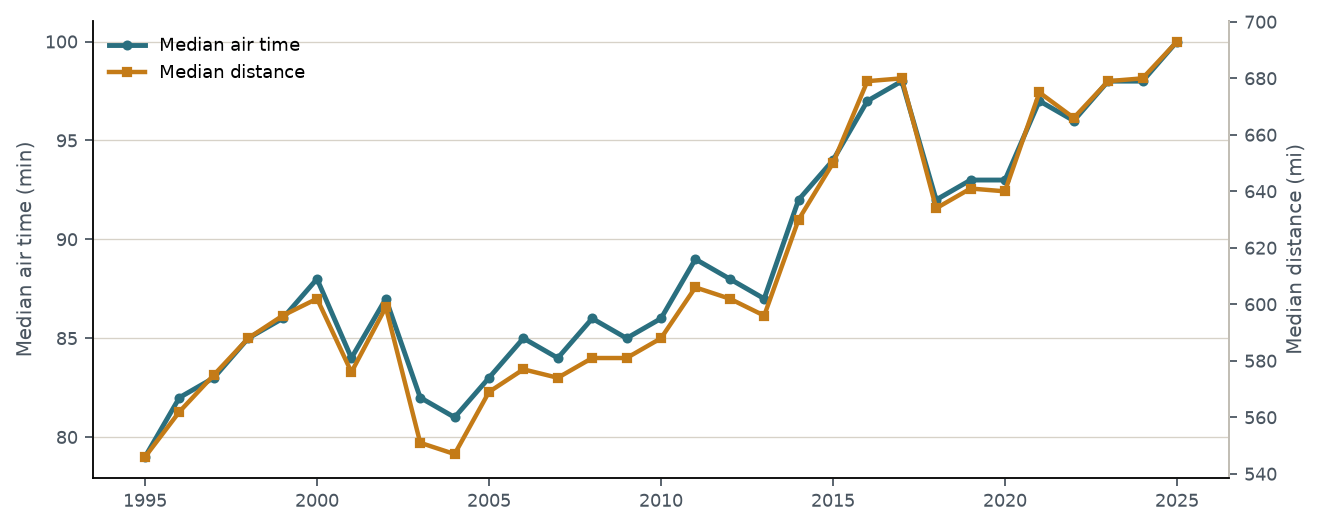
- The raw systemwide median air time did rise, from 79 minutes to 100 minutes. That tracks a longer typical flight (median distance 546 miles to 693 miles), not a slower trip over the same ground. Flights under 500 miles fell from 46.8% of the file to 33.6%.
- From 2010 to 2025, 1,827 continuing city-pairs show a median change of +0 minutes, and 85.6% stayed within 3 minutes.
- By network model, air time still did not lengthen. On continuing route–airline cells from 1995 to 2025, hub-and-spoke carriers (American Airlines, Delta Air Lines, United Airlines) had a median air-time change of +2 minutes; point-to-point (Southwest Airlines in that window) +1; hybrid (Alaska Airlines) 0.
- On flights of 2,000 miles and up, median air time rose from 283 to 296 minutes (+13).
Scheduled block time — covered in a companion report, not used in the air-time figures here — is BTS CRSElapsedTime: the airline’s computer-reservation-system (CRS) scheduled gate-to-gate time in the public BTS On-Time file (planned gate departure to gate arrival). “Block time” is the airline-industry term for that gate-to-gate span; BTS does not use the phrase itself. The Official Airline Guide (OAG) schedule is a separate commercial filing that Technical Directive No. 40 also has carriers report; OAG is not in the public On-Time file and is not used here. This page is actual air time only: wheels-up to wheels-down.
What was measured
Air time is the BTS field AirTime: wheels-up to wheels-down. It is the only flight-time measure used on this page. Taxi-out, taxi-in, and ActualElapsedTime are not used.
Scheduled block time (left to the companion report and not subtracted from air time here) is BTS CRSElapsedTime: the airline’s computer-reservation-system (CRS) scheduled time from gate departure to gate arrival. That CRS schedule is what the public BTS On-Time file carries. BTS Technical Directive No. 40 also has carriers report Official Airline Guide (OAG) schedule times; OAG is a separate commercial filing, is not in the public On-Time file, and is not used here. “Block time” is the airline-industry term for that gate-to-gate span; BTS does not use the phrase itself. Gate departure is when the pilot releases the parking brake after passengers have loaded and doors are closed (if the brake is not set, when the first passenger door closes); gate arrival is when the pilot sets the parking brake at the gate (if not set, when the first passenger door opens). ActualElapsedTime is the measured counterpart of the same span.
Data provenance. Publisher: U.S. Department of Transportation, Bureau of Transportation Statistics (BTS), Reporting Carrier On-Time Performance via Transtats PREZIP (https://transtats.bts.gov/PREZIP/). Years 1995–1999 also use the Harvard Dataverse copy of the same BTS series (Data Expo 2009, doi:10.7910/DVN/HG7NV7). Fields used from the public On-Time file for this page: Year, Month, Reporting_Airline, Origin, Dest, Distance, and AirTime. CRSElapsedTime appears only as the companion report’s scheduled field and is not subtracted from AirTime here.
Coverage and filters. Every published month from January 1995 through December 2025 (372 months). After ingest filters there are 189,225,468 operated flights with a reported Distance of at least 50 miles that were not cancelled or diverted, of which 189,223,380 have usable AirTime (positive and under 800 minutes). Filters: Cancelled = 0, Diverted = 0, Distance missing or ≥ 50 miles, and AirTime values ≤ 0 or ≥ 800 dropped when AirTime is present. The headline end year is 2025 (6,878,621 flights; 6,878,618 with AirTime). 2026 is January–August year-to-date and is not used as an endpoint. AirTime is blank in the BTS files before 1995.
What is not used. OAG schedule, taxi-out, taxi-in, ActualElapsedTime, on-time performance percentages, and block-minus-air. Minutes per 1,000 miles is the ratio of stored medians (median air time divided by median distance, times 1,000), not a new flight-level median. We also cross-checked a sample of BTS AirTime records against Spire satellite ADS-B in-air times and confirmed that the BTS data reflects reality (Spire Aviation ADS-B; sample size not separately tabulated).
The same city-pairs, thirty years later
This is the cleanest test of the claim that flights take longer in the air than they used to. It holds the set of city-pairs fixed, so a shift toward longer-haul flying cannot move the line.
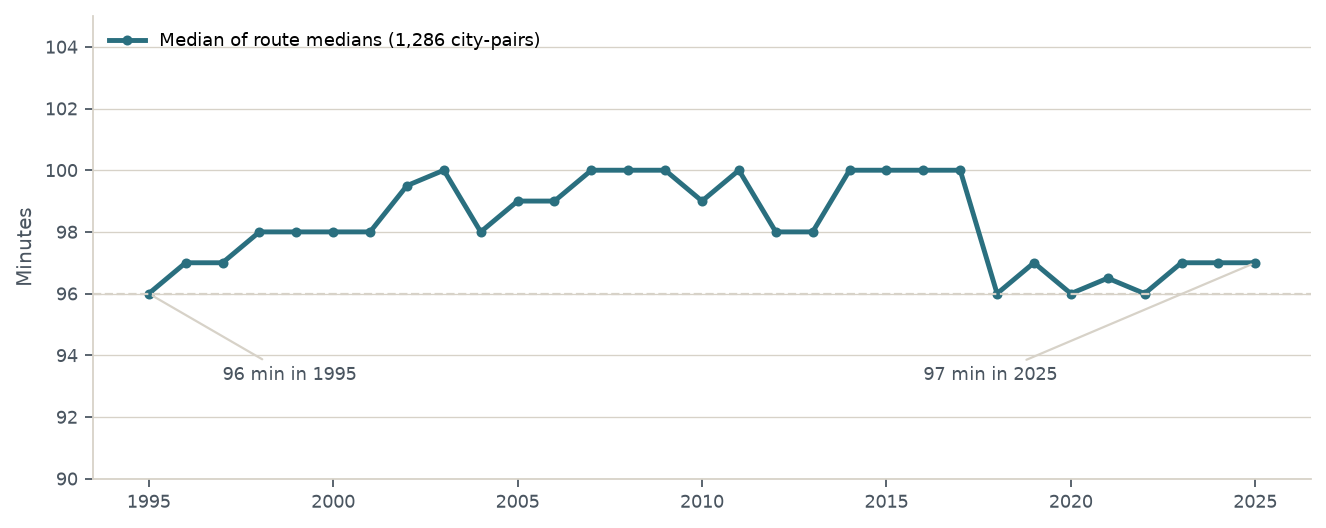
The panel high is 100 minutes. From the late 2010s through 2025 the basket sits at 97 minutes, one minute above 1995.
How the changes are distributed
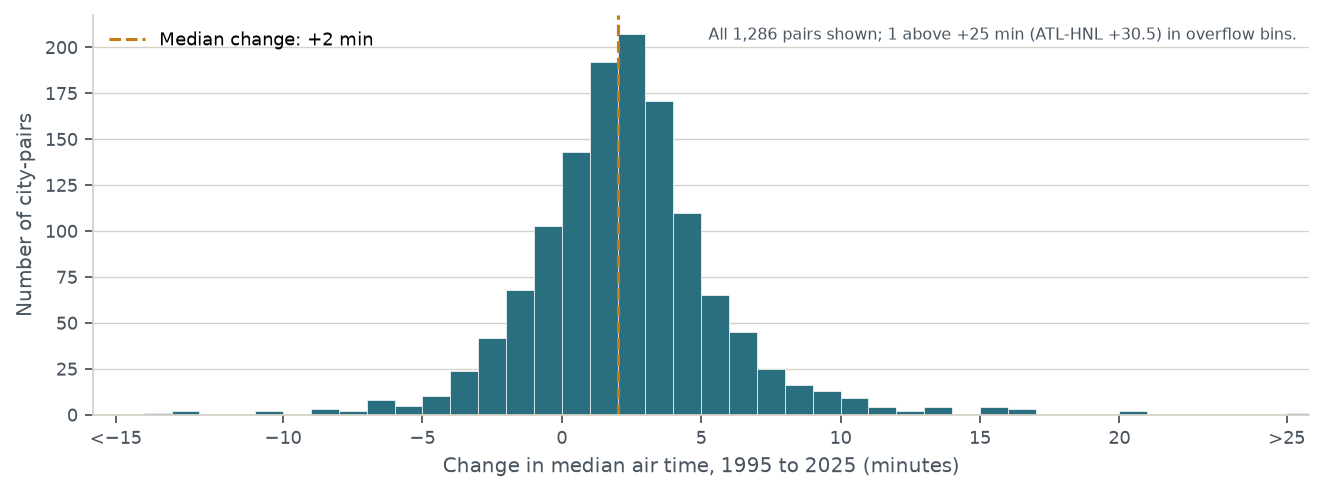
The mean change across those 1,286 pairs is +1.77 minutes. 307 pairs lengthened by more than 3 minutes and 57 shortened by more than 3 minutes. The 10th-to-90th percentile range of the change is −2 to +5.5 minutes. Among 738 route–airline cells present in both years, the median change is +2 minutes and 70.6% stay within 3 minutes.
| Unit | From | To | Cells | Median change | Flat ±3 min | Flat ±5 min |
|---|---|---|---|---|---|---|
| City-pairs | 1995 | 2025 | 1,286 | +2 min | 71.7% | 88.1% |
| City-pairs | 1995 | 2019 | 1,316 | +1 min | 73.6% | 89.1% |
| City-pairs | 2000 | 2025 | 1,361 | +1 min | 79.8% | 92.9% |
| City-pairs | 2010 | 2025 | 1,827 | +0 min | 85.6% | 94.6% |
| Route–airline | 1995 | 2025 | 738 | +2 min | 70.6% | 86.2% |
Distance, not pace, moved the raw median
If every flight is thrown into one pot, median AirTime rises from 79 minutes in 1995 to 100 minutes in 2025. Over the same span the median reported Distance rose from 546 miles to 693 miles. Flights under 500 miles were 46.8% of the 1995 file and 33.6% of the 2025 file; flights of 1,000 miles or more rose from 21.4% to 30.0%.
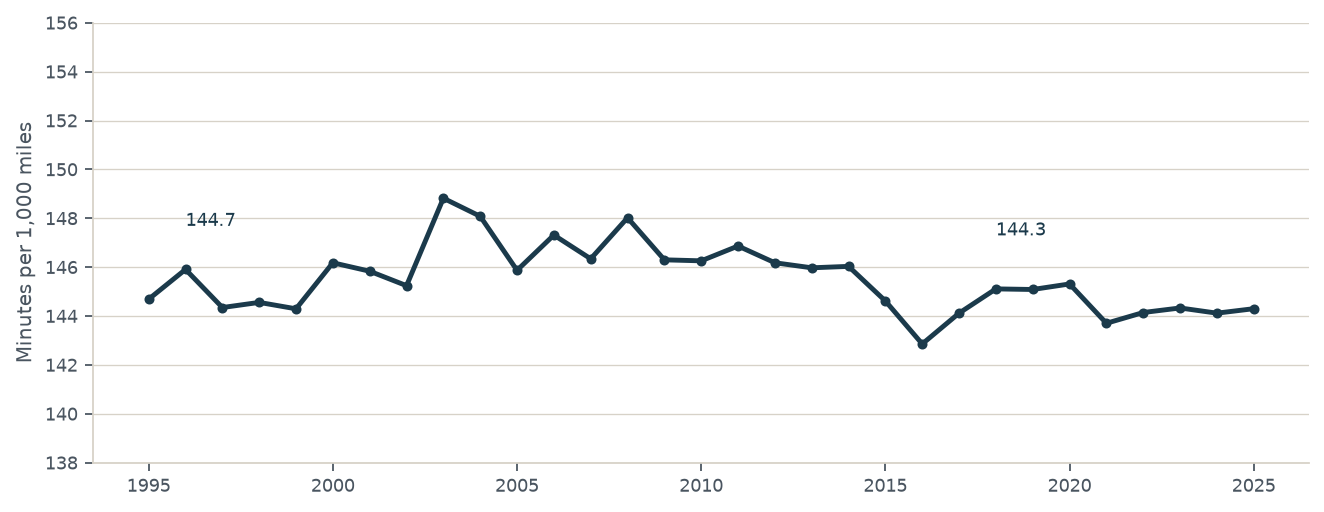
Seasonality: Air Times are essentially constant for all seasons
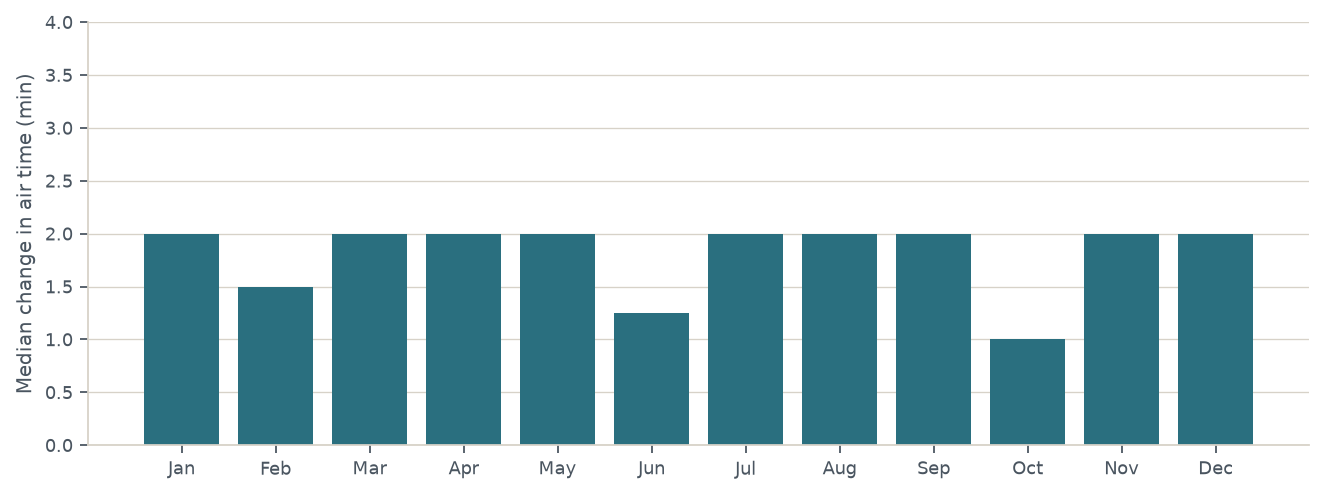
| Month | City-pairs | Median ∆ air | Air flat ±3 min |
|---|---|---|---|
| January | 1,131 | +2 | 62.2% |
| February | 1,122 | +1.5 | 63.0% |
| March | 1,131 | +2 | 61.9% |
| April | 1,125 | +2 | 66.7% |
| May | 1,118 | +2 | 65.0% |
| June | 1,130 | +1.25 | 69.9% |
| July | 1,121 | +2 | 69.8% |
| August | 1,125 | +2 | 66.3% |
| September | 1,104 | +2 | 68.4% |
| October | 1,103 | +1 | 68.2% |
| November | 1,099 | +2 | 66.2% |
| December | 1,116 | +2 | 64.0% |
By distance band
Cutting every flight into a distance band holds stage length nearly constant inside each slice. Median air time in 2025 is within 4 minutes of 1995 in every band except the longest domestic flights (2,000 miles and up), where the median rose +13 minutes, from 283 to 296. That band grew from 3.5% of flights in 1995 to 6.4% in 2025.
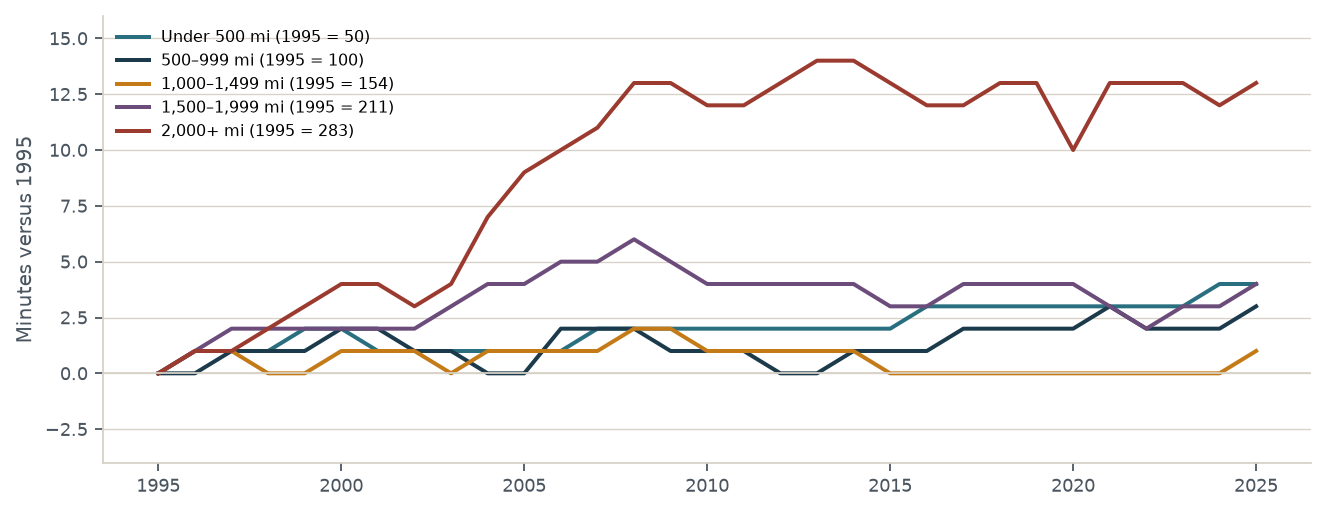
| Band | Air 1995 | Air 2025 | Change | Min/1,000 mi 1995 | Min/1,000 mi 2025 | Dist. 1995 | Dist. 2025 |
|---|---|---|---|---|---|---|---|
| Under 500 mi | 50 | 54 | +4 | 163.9 | 170.9 | 305 | 316 |
| 500–999 mi | 100 | 103 | +3 | 143.5 | 141.5 | 697 | 728 |
| 1,000–1,499 mi | 154 | 155 | +1 | 131.1 | 133.2 | 1,175 | 1,164 |
| 1,500–1,999 mi | 211 | 215 | +4 | 124.1 | 126.2 | 1,700 | 1,703 |
| 2,000+ mi | 283 | 296 | +13 | 117.9 | 122.4 | 2,401 | 2,419 |
Why the 2,000+ mile band rose (+13 min, 283 to 296, or 4.6%)
Almost all of that median increase arrived between 2004 and 2008 (290 in 2004, 296 in 2008), then plateaued through 2025. A 4.6% rise in the pooled median is not a 4.6% slowdown on the same routes.
Same routes: +6.1 minutes. Seventy-seven city-pairs over 2,000 miles were flown in both 1995 and 2025 (at least 30 flights each year; 168,329 flights in 1995 and 285,192 in 2025). Weighted by 1995 flights, their route-median air times rose 6.1 minutes (2025 weights: +6.3; the unweighted median of the 77 changes was +5.0). Minutes per 1,000 miles on those pairs rose from 119.9 to 122.3 under 1995 weights. The 11 continuing Hawaii pairs (HNL, OGG, KOA, LIH, ITO) rose 14.0 minutes; the 66 mainland pairs rose 4.7 minutes.
Slower cruise accounts for about 3 minutes of that same-route rise, not the full +13. A 2014 NEXTOR II study for the FAA measured a 1.1% weighted-average cruise-speed reduction between 2004/05 and 2011 for seven U.S. airlines (26% of 2004 U.S. available seat-miles), based on filed ground speed for aircraft types flown in both periods, while jet-fuel prices rose 91% (NEXTOR II Oil Impact, 2014). A 1.1% speed cut adds about 3.1 minutes to a 283-minute flight. An Associated Press report of 1 May 2008 described the practice: Southwest Airlines projected $42 million in fuel savings that year by extending each flight by one to three minutes, and JetBlue Airways about $13.6 million by adding just under two minutes on average (CBS News / AP). About 3 minutes of the 6.1-minute same-route rise is unexplained by that speed cut.
Mix accounts for 4.8 minutes of a 10.9-minute rise in the flight-weighted average of route-level median air times (288.2 to 299.1). Of that +10.9, 6.1 minutes is the same-route effect and 4.8 minutes is mix — almost entirely 155 city-pairs that were not flown in 1995, which were 35% of 2025’s 2,000+ mile flights, were longer (flight-weighted 2,533 miles versus 2,401 on the continuing pairs), and were 40.6% Hawaii. Hawaii’s share of 2,000+ mile flights rose from 14.2% to 22.5%. Reweighting among the 77 continuing pairs subtracted 0.4 minutes. Median distance inside the band moved only from 2,401 to 2,419 miles, which at the 1995 pace would add about 2 minutes. The published +13 is the flight-level median of every 2,000+ mile flight, a different statistic from the 10.9-minute rise in the weighted average of route medians; the two are not added to each other.
By airline
A carrier’s raw median air time moves when that carrier’s typical hop gets longer or shorter. Southwest Airlines is the clearest case: its median distance rose from 337 miles in 1995 to 669 miles in 2025, and its raw median air time rose from 53 to 95 minutes. Per 1,000 miles, Southwest Airlines went the other way, from 157.3 to 142.0.
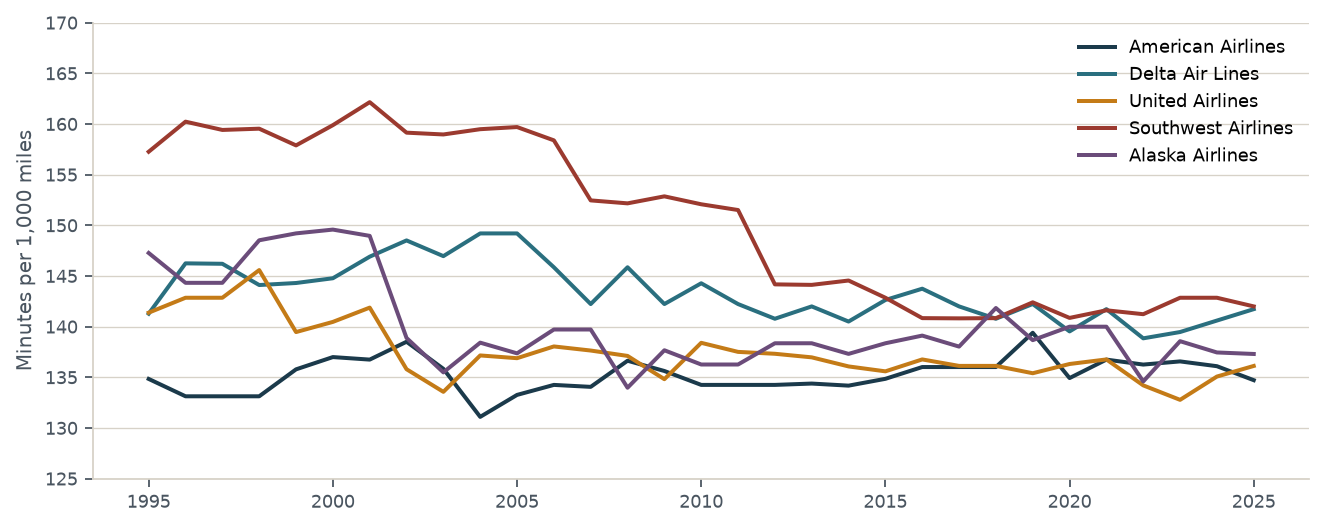
| Airline | Air 1995 | Air 2025 | Change | Min/1,000 mi 1995 | Min/1,000 mi 2025 | Dist. 1995 | Dist. 2025 |
|---|---|---|---|---|---|---|---|
| American Airlines | 125 | 123 | −2 | 134.8 | 134.7 | 927 | 913 |
| Delta Air Lines | 77 | 108 | +31 | 141.3 | 141.7 | 545 | 762 |
| United Airlines | 96 | 130 | +34 | 141.4 | 136.1 | 679 | 955 |
| Southwest Airlines | 53 | 95 | +42 | 157.3 | 142.0 | 337 | 669 |
| Alaska Airlines | 100 | 152 | +52 | 147.3 | 137.3 | 679 | 1,107 |
Carriers that do not appear in the 1995 file — including JetBlue Airways, Frontier Airlines, Hawaiian Airlines, and Spirit Airlines — have no 1995 baseline here.
Hub-and-spoke versus point-to-point
Classification. Hub-and-spoke (legacy): American Airlines, Delta Air Lines, United Airlines, and predecessors present in the panel (Continental Airlines, Northwest Airlines, US Airways, Trans World Airlines, America West Airlines). Point-to-point / low-cost: Southwest Airlines, JetBlue Airways, Spirit Airlines, Frontier Airlines, Allegiant Air, AirTran Airways, Virgin America, Sun Country Airlines, and Breeze Airways. Hybrid: Alaska Airlines and Hawaiian Airlines. Regionals that mainly feed hubs (SkyWest Airlines, Envoy Air, and similar) are not treated as a network-model contrast here. The rule follows each carrier’s published network model; it is not inferred from a single year of flying.
Data check. In 2025, the three hub-and-spoke mainline carriers put 34 to 35 percent of their departures through their top-three origin airports (American Airlines 35.4% at Dallas/Fort Worth, Charlotte, and Miami; Delta Air Lines 35.4% at Atlanta, Minneapolis–Saint Paul, and Detroit; United Airlines 34.4% at Denver, Chicago O’Hare, and Houston Intercontinental). Southwest Airlines put 17.9% through its top three (Denver, Las Vegas, and Baltimore). Allegiant Air was similarly diffuse at 21.1%. JetBlue Airways is classified point-to-point by published model but concentrates more at focus cities (40.6% at Boston, New York JFK, and Fort Lauderdale in 2025), so concentration alone is not the classifier.
Limits. From 1995 to 2025 the only continuing point-to-point route–airline cells are Southwest Airlines (139 cells). JetBlue Airways, Frontier Airlines, Spirit Airlines, and Allegiant Air have no 1995 baseline. The 2010-to-2025 window adds JetBlue Airways (83 cells) and Frontier Airlines (39) beside Southwest Airlines (397). Hybrid in the 30-year window is Alaska Airlines only; Hawaiian Airlines enters the 2010-to-2025 hybrid row.
| Network model | Cells | Carriers in window | Median ∆ air | Within 3 min | Air 1995 | Air 2025 |
|---|---|---|---|---|---|---|
| Hub-and-spoke (legacy) | 545 | American Airlines, Delta Air Lines, United Airlines | +2 | 63.7% | 116 | 117 |
| Point-to-point / low-cost | 139 | Southwest Airlines | +1 | 89.2% | 64 | 66 |
| Hybrid | 54 | Alaska Airlines | 0 | 92.6% | 97.5 | 97 |
Holding the 1995-to-2025 continuing cells fixed as a basket, the median of route–airline median air times moved from 116 to 117 minutes for hub-and-spoke, 64 to 66 for point-to-point, and 97.5 to 97 for hybrid.
| Network model (2010–2025) | Cells | Median ∆ air | Within 3 min | Carriers |
|---|---|---|---|---|
| Hub-and-spoke (legacy) | 635 | 0 | 86.3% | American Airlines, Delta Air Lines, United Airlines |
| Point-to-point / low-cost | 519 | −1 | 89.2% | Southwest Airlines, JetBlue Airways, Frontier Airlines |
| Hybrid | 101 | 0 | 86.1% | Alaska Airlines, Hawaiian Airlines |
Qualitative contrast (not measured here). Hub-and-spoke carriers schedule connecting banks — concentrated waves of arrivals and departures at a hub so passengers can change planes — which the FAA has long described as a peak-load pattern that needs enough airside capacity to clear each bank. Point-to-point carriers publish mostly nonstop origin–destination flying without those connecting banks; Southwest Airlines is the long-running U.S. example. That contrast is about how flights are scheduled on the ground and through the airport, not about wheels-up to wheels-down air time. Once the aircraft is airborne on the same city-pair, the network model does not produce a material lengthening story.
What this section does not cover. It does not measure taxi-out, taxi-in, connecting time, bank integrity, or GoScore Total Ground Time. It does not treat scheduled block minus air time as ground time. Regionals are omitted from the model headlines because they mainly feed hubs rather than define a rival network form.
Busiest city-pairs
Among the 50 city-pairs with the most combined 1995 and 2025 flights, the median air-time growth is +2.6%. 39 of those 50 stayed within 3 minutes; 11 lengthened by more than 3 minutes; 0 shortened by more than 3 minutes.
| City-pair | Air 1995 | Air 2025 | % change | Flights 1995 | Flights 2025 | Distance (mi) |
|---|---|---|---|---|---|---|
| LAX–SFO | 54 | 55 | +1.9% | 32,296 | 21,582 | 337 |
| LAS–LAX | 42 | 43 | +2.4% | 34,273 | 17,415 | 236 |
| LAX–PHX | 57 | 59 | +3.5% | 30,447 | 15,183 | 370 |
| LGA–ORD | 102 | 107 | +4.9% | 22,072 | 22,382 | 733 |
| MSP–ORD | 56 | 59 | +5.4% | 28,121 | 12,288 | 334 |
| LAS–PHX | 43 | 44 | +2.3% | 24,611 | 12,601 | 256 |
| JFK–LAX | 297 | 307 | +3.4% | 16,227 | 20,267 | 2,475 |
| DFW–IAH | 41 | 44 | +7.3% | 23,428 | 11,245 | 224 |
| LAX–ORD | 216 | 219 | +1.4% | 20,051 | 13,969 | 1,745 |
| SEA–SFO | 97 | 100 | +3.1% | 18,642 | 13,700 | 679 |
| DFW–ORD | 110 | 111 | +0.9% | 19,235 | 13,056 | 802 |
| BOS–ORD | 118 | 122 | +3.4% | 17,025 | 14,324 | 867 |
| EWR–ORD | 102 | 104 | +2.0% | 19,631 | 11,681 | 719 |
| LAX–OAK | 54 | 55 | +1.9% | 26,700 | 4,456 | 337 |
| BOS–DCA | 67 | 70 | +4.5% | 12,765 | 17,642 | 399 |
| DAL–HOU | 41 | 44 | +7.3% | 22,346 | 7,964 | 239 |
| DCA–ORD | 86 | 91 | +5.8% | 16,881 | 13,111 | 612 |
| ATL–DFW | 103 | 103 | +0.0% | 16,866 | 12,898 | 732 |
| SAN–SFO | 66 | 68 | +3.0% | 16,447 | 13,225 | 447 |
| LAX–SEA | 130 | 131 | +0.8% | 14,792 | 14,643 | 954 |
| ATL–ORD | 88 | 89 | +1.1% | 17,083 | 12,115 | 606 |
| DFW–LAX | 157 | 159 | +1.3% | 15,428 | 12,901 | 1,235 |
| ANC–SEA | 185 | 185 | +0.0% | 14,596 | 13,614 | 1,449 |
| DEN–PHX | 84 | 85 | +1.2% | 9,882 | 17,903 | 602 |
| DEN–DFW | 90 | 91 | +1.1% | 15,878 | 11,754 | 641 |
Where air time did move
The claim is not that no route changed. Long domestic sectors — transcontinental flights and Hawaii — show the largest increases. On the 77 city-pairs over 2,000 miles flown in both 1995 and 2025, air time rose 6.1 minutes when weighted by 1995 flights. A 1.1% slower cruise would account for about 3 of those minutes; about 3 minutes on the same routes is unexplained. Mix — new, longer, more Hawaii-heavy pairs — accounts for 4.8 minutes of the 10.9-minute rise in the flight-weighted average of route medians.
Largest increases
| City-pair | Air 1995 | Air 2025 | Change | Flights 1995 | Flights 2025 | Distance (mi) |
|---|---|---|---|---|---|---|
| ATL–HNL | 489.5 | 520 | +30.5 | 492 | 751 | 4,502 |
| HNL–SAN | 297.5 | 318 | +20.5 | 224 | 3,166 | 2,614 |
| ATL–SEA | 251 | 271 | +20 | 1,805 | 6,433 | 2,182 |
| OGG–SFO | 268 | 284 | +16 | 1,362 | 2,965 | 2,338 |
| LAX–OGG | 283 | 299 | +16 | 1,071 | 3,743 | 2,486 |
| ATL–PDX | 251 | 267 | +16 | 1,329 | 3,148 | 2,172 |
| DFW–HNL | 417 | 432 | +15 | 2,135 | 1,117 | 3,784 |
| HNL–LAX | 289 | 304 | +15 | 9,956 | 10,574 | 2,556 |
Largest decreases
| City-pair | Air 1995 | Air 2025 | Change | Flights 1995 | Flights 2025 | Distance (mi) |
|---|---|---|---|---|---|---|
| MSP–SJU | 313 | 298 | −15 | 83 | 342 | 2,404 |
| CLE–SEA | 261 | 247 | −14 | 382 | 893 | 2,021 |
| ATL–ELP | 172.5 | 159 | −13.5 | 58 | 1,410 | 1,282 |
| ATL–STX | 215 | 204 | −11 | 60 | 246 | 1,638 |
| PDX–STL | 222 | 211 | −11 | 1,913 | 67 | 1,708 |
| CLT–SAN | 262 | 253 | −9 | 402 | 3,131 | 2,077 |
| SJC–STL | 225 | 216 | −9 | 1,424 | 37 | 1,716 |
| CLE–SFO | 274 | 265 | −9 | 1,083 | 1,289 | 2,161 |
Data sources and what is not used
The only flight-time field used for the air-time figures on this page is BTS On-Time Performance AirTime: wheels-up to wheels-down, in minutes. Taxi, gate-to-gate elapsed time (ActualElapsedTime), on-time percentages, and scheduled block (CRSElapsedTime) are out of scope for the air-time numbers. Scheduled block time is defined above as the CRS reservation-system scheduled gate-to-gate time; the Official Airline Guide (OAG) schedule is not in the public file and is not used.
Flights are kept if they were not cancelled, not diverted, had a positive AirTime under 800 minutes, and a reported Distance of at least 50 miles. The panel is every month from January 1995 through December 2025 — 372 consecutive months, 189,223,380 flights with AirTime. AirTime is blank in BTS before 1995, so the series cannot start earlier. Years 1995–1999 come from the Harvard Dataverse copy of the same BTS series (Data Expo 2009, doi:10.7910/DVN/HG7NV7). Years 2000–2025 come from BTS PREZIP files. We also cross-checked a sample of BTS AirTime records against Spire satellite ADS-B in-air times and confirmed that the BTS data reflects reality (sample size not separately tabulated). City-pairs are undirected (ATL–ORD pools both directions).
Systemwide figures, every year
| Year | Flights with AirTime | Median air (min) | Mean air (min) | Median miles | Min / 1,000 mi |
|---|---|---|---|---|---|
| 1995 | 5,219,473 | 79 | 97.4 | 546 | 144.7 |
| 1996 | 5,205,639 | 82 | 99.8 | 562 | 145.9 |
| 1997 | 5,298,222 | 83 | 101.3 | 575 | 144.3 |
| 1998 | 5,223,264 | 85 | 103.0 | 588 | 144.6 |
| 1999 | 5,356,880 | 86 | 104.8 | 596 | 144.3 |
| 2000 | 5,477,897 | 88 | 106.5 | 602 | 146.2 |
| 2001 | 5,721,595 | 84 | 103.3 | 576 | 145.8 |
| 2002 | 5,196,080 | 87 | 105.8 | 599 | 145.2 |
| 2003 | 6,355,695 | 82 | 101.1 | 551 | 148.8 |
| 2004 | 6,968,238 | 81 | 101.5 | 547 | 148.1 |
| 2005 | 6,977,919 | 83 | 102.8 | 569 | 145.9 |
| 2006 | 6,990,741 | 85 | 103.7 | 577 | 147.3 |
| 2007 | 7,266,676 | 84 | 102.9 | 574 | 146.3 |
| 2008 | 6,851,443 | 86 | 104.1 | 581 | 148.0 |
| 2009 | 6,341,756 | 85 | 103.5 | 581 | 146.3 |
| 2010 | 6,319,595 | 86 | 103.9 | 588 | 146.3 |
| 2011 | 5,954,054 | 89 | 107.3 | 606 | 146.9 |
| 2012 | 6,004,109 | 88 | 107.7 | 602 | 146.2 |
| 2013 | 6,258,454 | 87 | 107.0 | 596 | 146.0 |
| 2014 | 5,677,534 | 92 | 111.4 | 630 | 146.0 |
| 2015 | 5,713,148 | 94 | 113.5 | 650 | 144.6 |
| 2016 | 5,537,225 | 97 | 116.5 | 679 | 142.9 |
| 2017 | 5,578,543 | 98 | 117.5 | 680 | 144.1 |
| 2018 | 7,070,938 | 92 | 111.5 | 634 | 145.1 |
| 2019 | 7,266,197 | 93 | 111.6 | 641 | 145.1 |
| 2020 | 4,398,469 | 93 | 109.1 | 640 | 145.3 |
| 2021 | 5,877,336 | 97 | 113.2 | 675 | 143.7 |
| 2022 | 6,530,723 | 96 | 112.8 | 666 | 144.1 |
| 2023 | 6,742,552 | 98 | 114.8 | 679 | 144.3 |
| 2024 | 6,964,367 | 98 | 115.0 | 680 | 144.1 |
| 2025 | 6,878,618 | 100 | 116.9 | 693 | 144.3 |
How to read these numbers
BTS Distance is the scheduled or great-circle mileage, not the miles actually flown. If airways became more circuitous, that would appear here as more AirTime per reported mile. The per-mile series did not rise over the full span. The file is US domestic reporting carriers only. The set of reporting carriers expanded over time, notably around 2003 and again in 2018. Fleet mix is not separately held constant. Distance bands and minutes per 1,000 miles absorb stage-length mix; they do not isolate aircraft type. City-pairs are undirected, so each pair pools outbound and inbound flights. None of this speaks to time on the ground. Gate-to-gate time, taxi, and scheduled block time (BTS CRSElapsedTime — the airline CRS reservation-system scheduled gate-to-gate span) are different quantities.
Sources
- U.S. Bureau of Transportation Statistics, Reporting Carrier On-Time Performance (1987–present), field AirTime. Monthly PREZIP files for 2000–2025: https://transtats.bts.gov/PREZIP/.
- BTS field definitions (AirTime / CRSElapsedTime): https://www.transtats.bts.gov/Fields.asp?gnoyr_VQ=FGJ.
- BTS Technical Directive No. 40, Reporting of Time: https://www.bts.gov/explore-topics-and-geography/modes/aviation/number-40-technical-directive-reporting-time.
- BTS Transtats terms (Airline On-Time Performance): https://www.transtats.bts.gov/DatabaseInfo.asp?QO_VQ=EFD.
- The same BTS series for 1995–1999 via Harvard Dataverse, Data Expo 2009, doi:10.7910/DVN/HG7NV7 (https://doi.org/10.7910/DVN/HG7NV7).
- NEXTOR II, The Impact of Oil Prices on the Air Transportation Industry, 28 March 2014: https://isr.umd.edu/NEXTOR/pubs/NEXTOR-II-Oil-Impact-3-2014.pdf.
- CBS News / Associated Press, “Airlines Slow Down Flights To Save On Fuel,” 1 May 2008: https://www.cbsnews.com/news/airlines-slow-down-flights-to-save-on-fuel/.
- Spire Aviation ADS-B flight tracking data: https://spire.com/aviation/.
- FAA, New Connecting Hub Airports Study (1990): https://rosap.ntl.bts.gov/view/dot/12648.
- Cook and Goodwin, Airline Networks: Hub-and-Spoke vs Point-to-Point (JAAER, 2008): https://doi.org/10.15394/jaaer.2008.1443.
- GoScore.
Prepared by GoScore · Research and analysis by Grok Bot.
Every BTS figure is computed from the AirTime files named above; none are invented. The 1.1% cruise-speed figure is quoted from NEXTOR II (2014).